Testing 1, 2, 3 (Simulator)
Building better testing tools
With new developments, testing by hand is no longer practical!
As a result, I've developed a Simulator which will do all the major testing from now on.
This post is just a show-and-tell because it's a fun tool.
Comprehensive Simulator / Test Harness
Testing now makes use of new Simulator capabilities, such as:
- Simulating any scenario, directly feeding encoded data into the live Dashboard
- No need to transmit to test
- 27,000+ automated tests, across comprehensive input values, midpoints, etc
- Test every message type (extensible to new)
- Test pairs of messages (TT+GT, RT1+BT, etc)
Major Features
- Simulation of "real" data by
Simulator, then sent to Jetpack via JSON link- Encoding performed ON Jetpack using Jetpack encoder/decoder
- Encoding performed Simulator using Dashboard encoder/decoder
- Resulting values compared by Simulator and differences flagged
- Drawable GPS path on map
- With comparative view of grid4/grid6 snap-to path
- Drawable altitude/speed/temperature/voltage values
- Bulk Comprehensive test scenarios auto-generated
- Window construction (any messages, any field values, in any slots)
- Fingerprinting scenarios
- Multiple sending profiles to operate simultaneously
- Any band/channel
- Multiple receiving station profiles to operate simultaneously
- Any band/freq-offset
- Multiple sending profiles to operate simultaneously
- Solar angle conditions (choose date/time of simulated period)
Other Cool Stuff
- 2.6 Mbps data throughput between Simulator and Jetpack traffic via JSON link
- That's 325,000 bytes/sec for write, and another 325,000 bytes/sec for read
- Reliable high-bandwidth link supports high-volume low-latency testing
More work to be done to move this set of work ahead but now much easier to test and re-test as changes get made to see what works.
Quick Tour
Simulating directly into the Dashboard
Testing easier, faster, and exercises Dashboard exactly as real data would
The Simulator UI (left browser window):
- Generates thousands of rows of data based on input
- Sends that data directly to Dashboard as encoded data
Dashboard UI (right browser window):
- Doesn't know it's simulated data
- Thinks it is a real database query
- Decodes / Fingerprints / Charts
All that happens in realtime, so testing becomes instantaneous.
Live demo
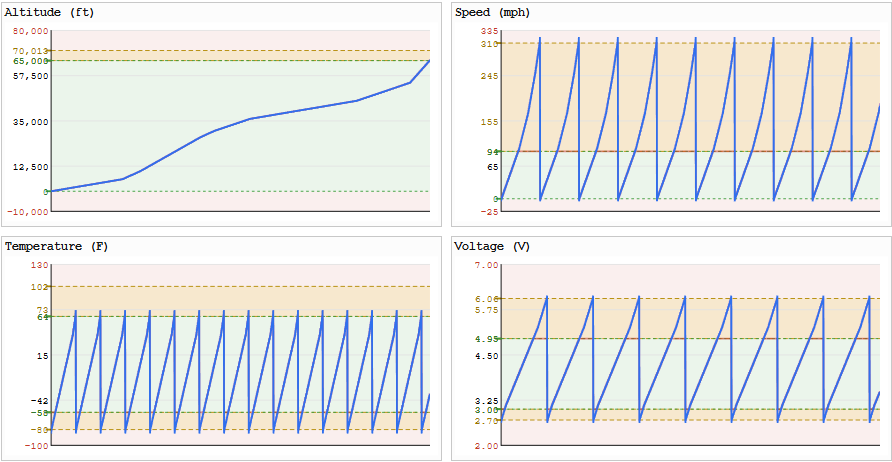
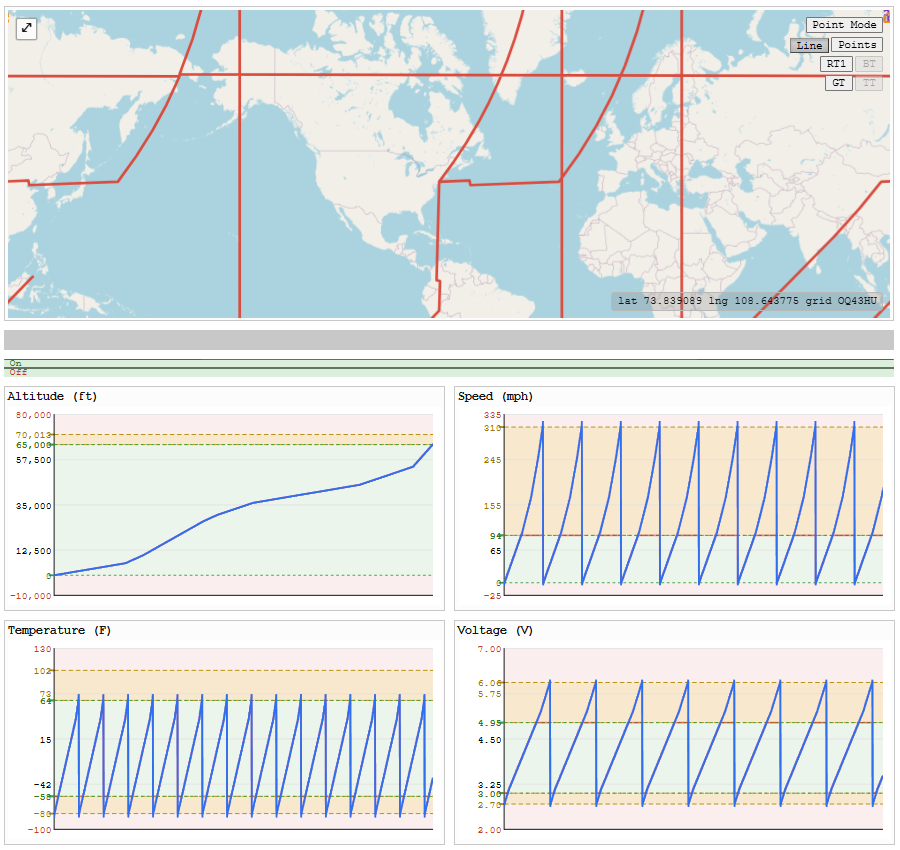
Below you see:
- New altitude data drawn and decoded/updated on the Dashboard
- New GPS path drawn, mapped onto TT+GT messages and decoded/updated on the Dashboard
- The
Simulatormap view enabling "RT1=RegularType1" grid4-only view overlaid on real data path - The
Simulatorchanging mapping of real data onto RT1 and sending to Dashboard, matching the preview
Automated Tests
Comprehensive test input generation
Manually "drawing" or inputting data is good for small tests of particular scenarios, but that's not good enough for large-scale testing.
For large scale testing, for any message type, the Simulator knows how to generate:
- For every field:
- Every input value
- Plus midpoint values
- Plus intermediate values to those points
- Plus invalid "outside the range" values
The field with the largest number of inputs dictates the number of test windows.
If one field has more steps than others (eg more altitude steps than voltage), then every altitude (and intermediates) will get stepped through and repeats on voltage will occur in a pattern.
All GPS locations are stress tested as well
Not seen on the map (pin markers disabled to show lines), but all boundary and intermediate steps along boundary boxes for (say) grid4 and grid6 are stepped along for testing and striped around the world.
Of course not every GPS coordinate is used (too many) but one of each lat/lng and partial steps along each is (hence the huge paths swept across the Earth on the map).
Here is an example of test data generated
This data:
- Walks the Earth
- Steps along every altitude and intermediate altitude
- Repeats a number of speed/temp/voltage values because there are fewer of those than altitude
This complete generated comprehensive test dataset is just one of the automated test datasets.
Automated testing
The Simulator will:
- Create comprehensive test data for each scenario (eg RT1+BT)
- Send each scenario's "real" data to Jetpack to encode and return
- Compare the Jetpack-encoded against its own encode/decode using Dashboard libraries
- Compare the Jetpack-encoded against the pre-encoded data
- Color green on success
Here is a run of the 27,000+ tests (sped up)
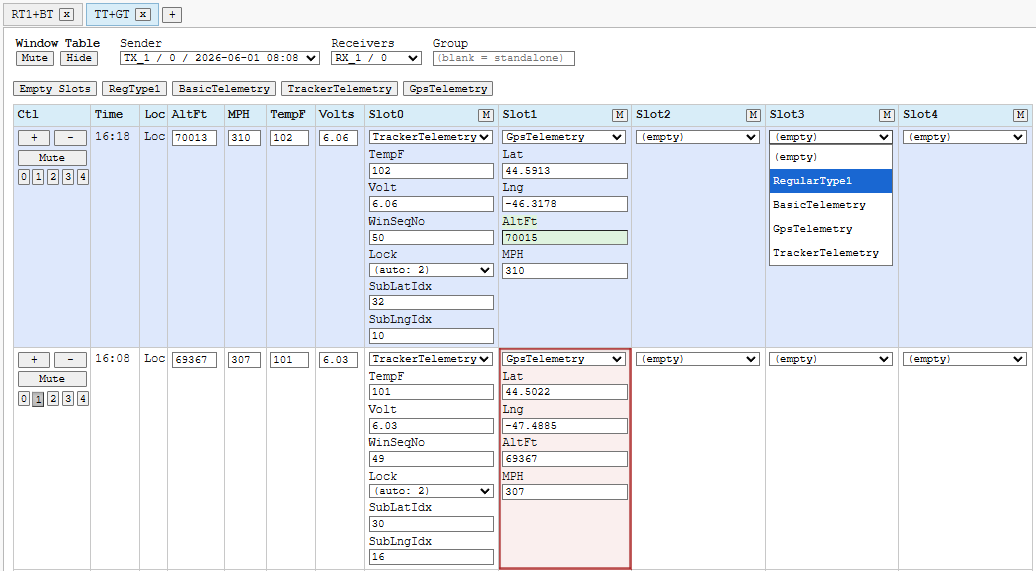
Precision Testing Scenarios
Precision control over simulated data
You can generate or draw the real data inputs.
You can also manually enter them, or override them.
The Simulator automatically maps the generated/drawn data onto message types you select for a given slot in a window.
You can override a mapped value, mute cells, or a variety of other operations to achieve a particular result.
And so, so much more.
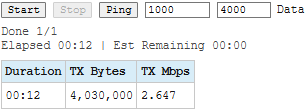
Speed Test
Reliable high-speed low-latency Jetpack link
The reliable high-speed communication link to Jetpack enables huge quantities of test data to be exchanged via JSON.
A speed test benchmarked the throughput rate at over 2.6 Mbps (over 325,000 bytes/sec) with 0 loss.
Future
Refine and re-test changes to new messages (more coming) and Dashboard.